

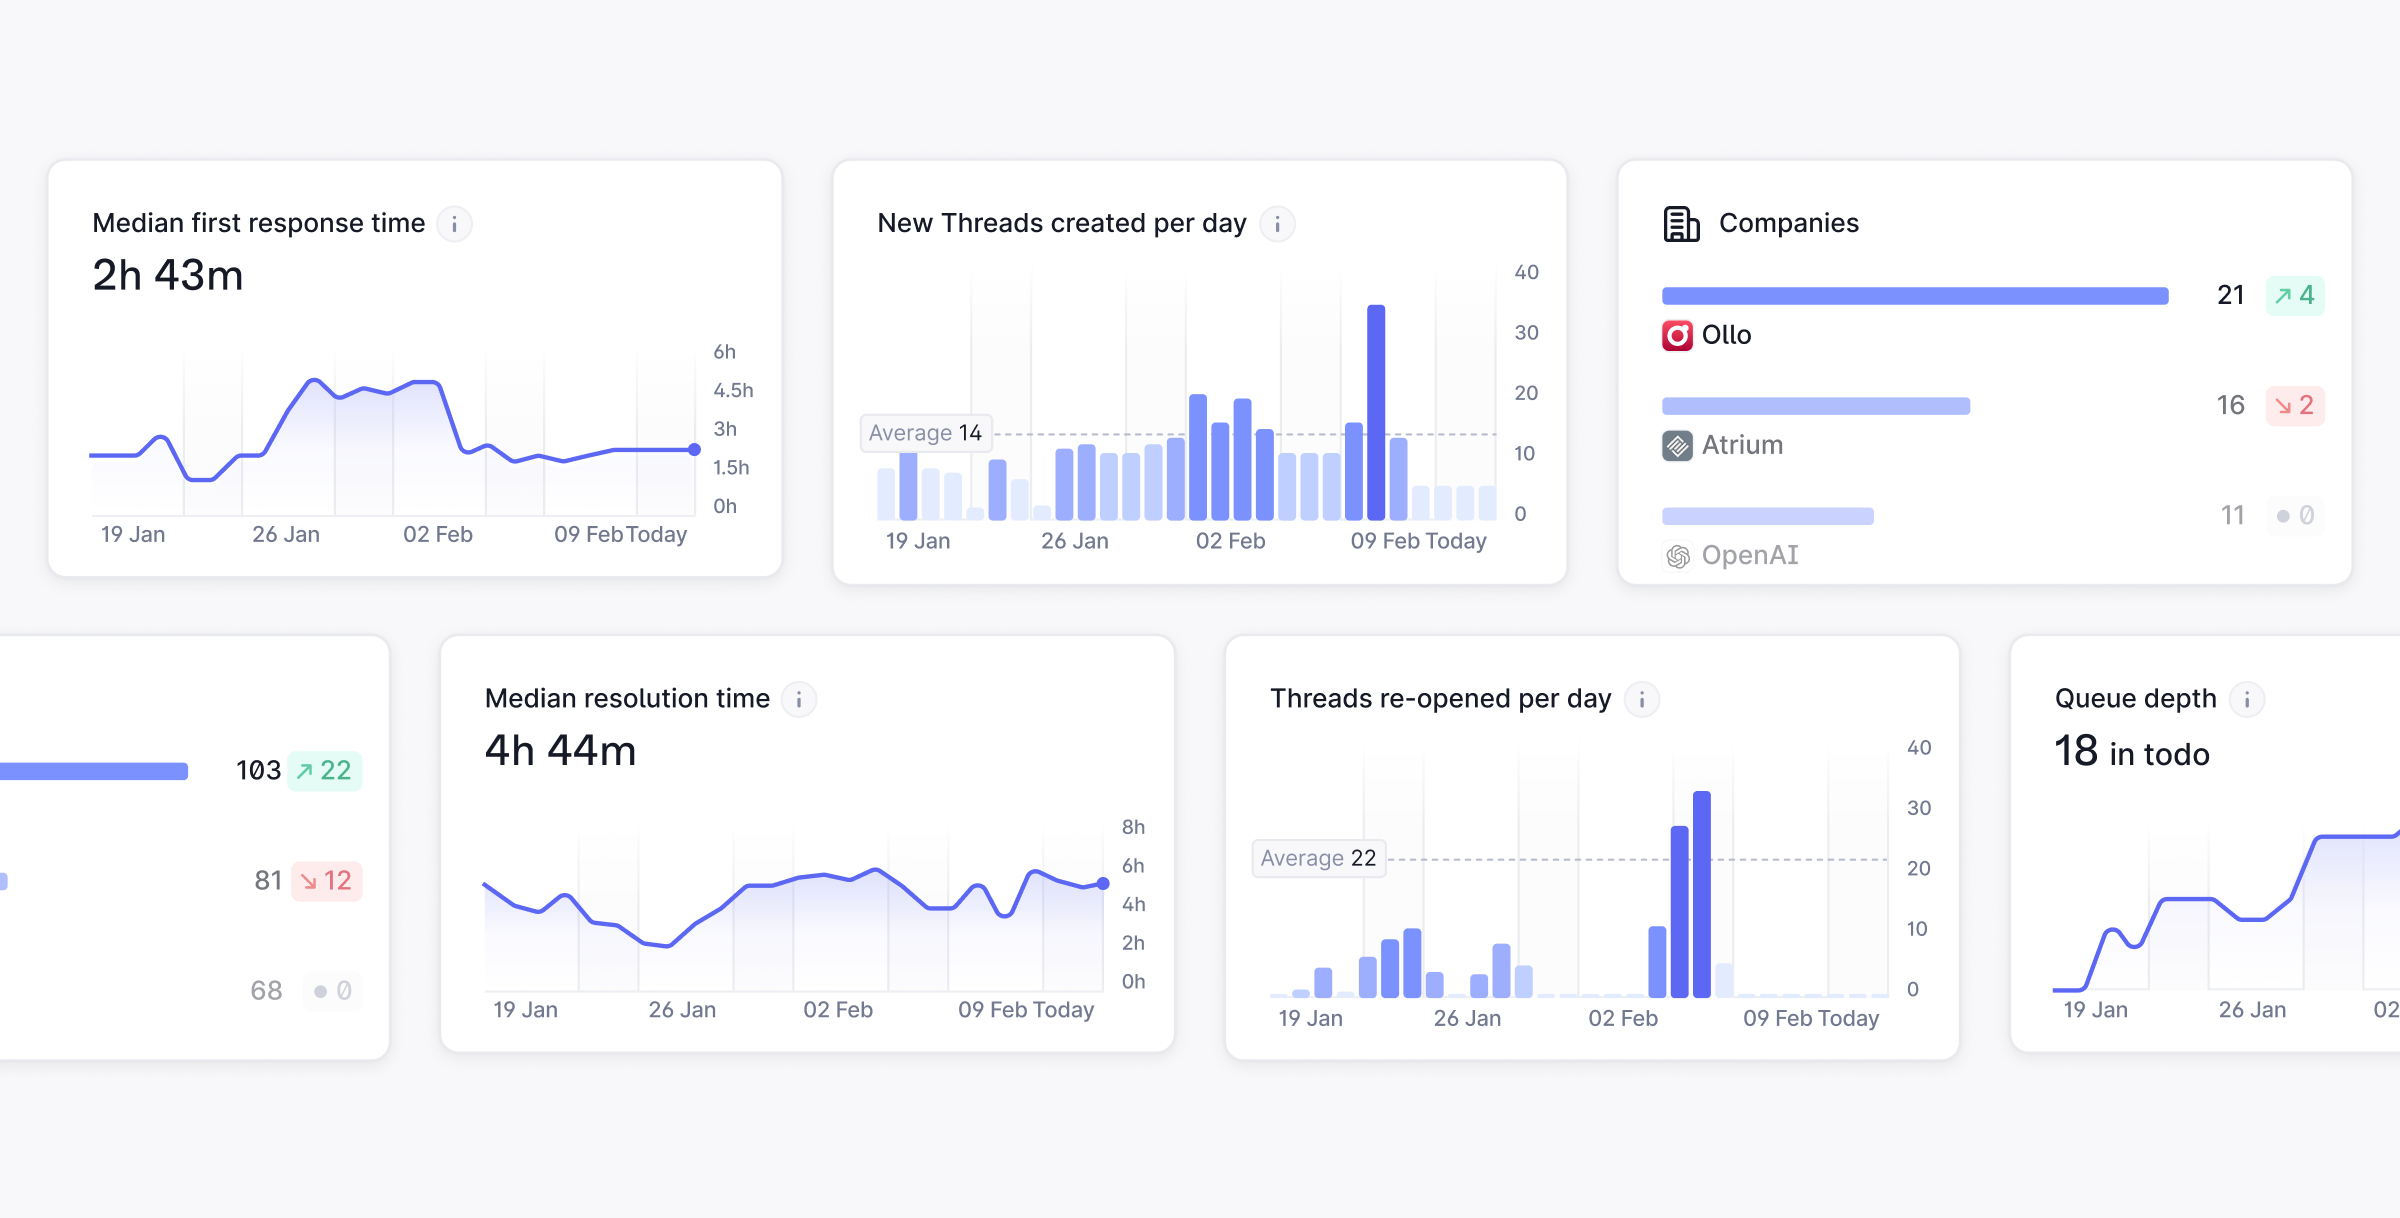
- Are we prioritizing support requests correctly?
- What product areas are creating most of our support volume?
- What companies are we speaking with most?
- Are we becoming more efficient?
- And lots more
Using Insights
You can access Insights from the left sidebar of the Plain app or by hovering over a Label, Tier, Group or Company tag on a thread. Insights give you the following metrics and much more:- Support volume: The number amount of threads in your queue at any given point in time.
- First response time: How quickly your customers receive a first reply from you.
- Resolution time: How long it takes you to resolve support requests.
Get a birds-eye view
At the top of the Insights page you will see the overall health of your support. How is your queue looking? Are you keeping up with your response time targets? Are you resolving your customers requests quickly?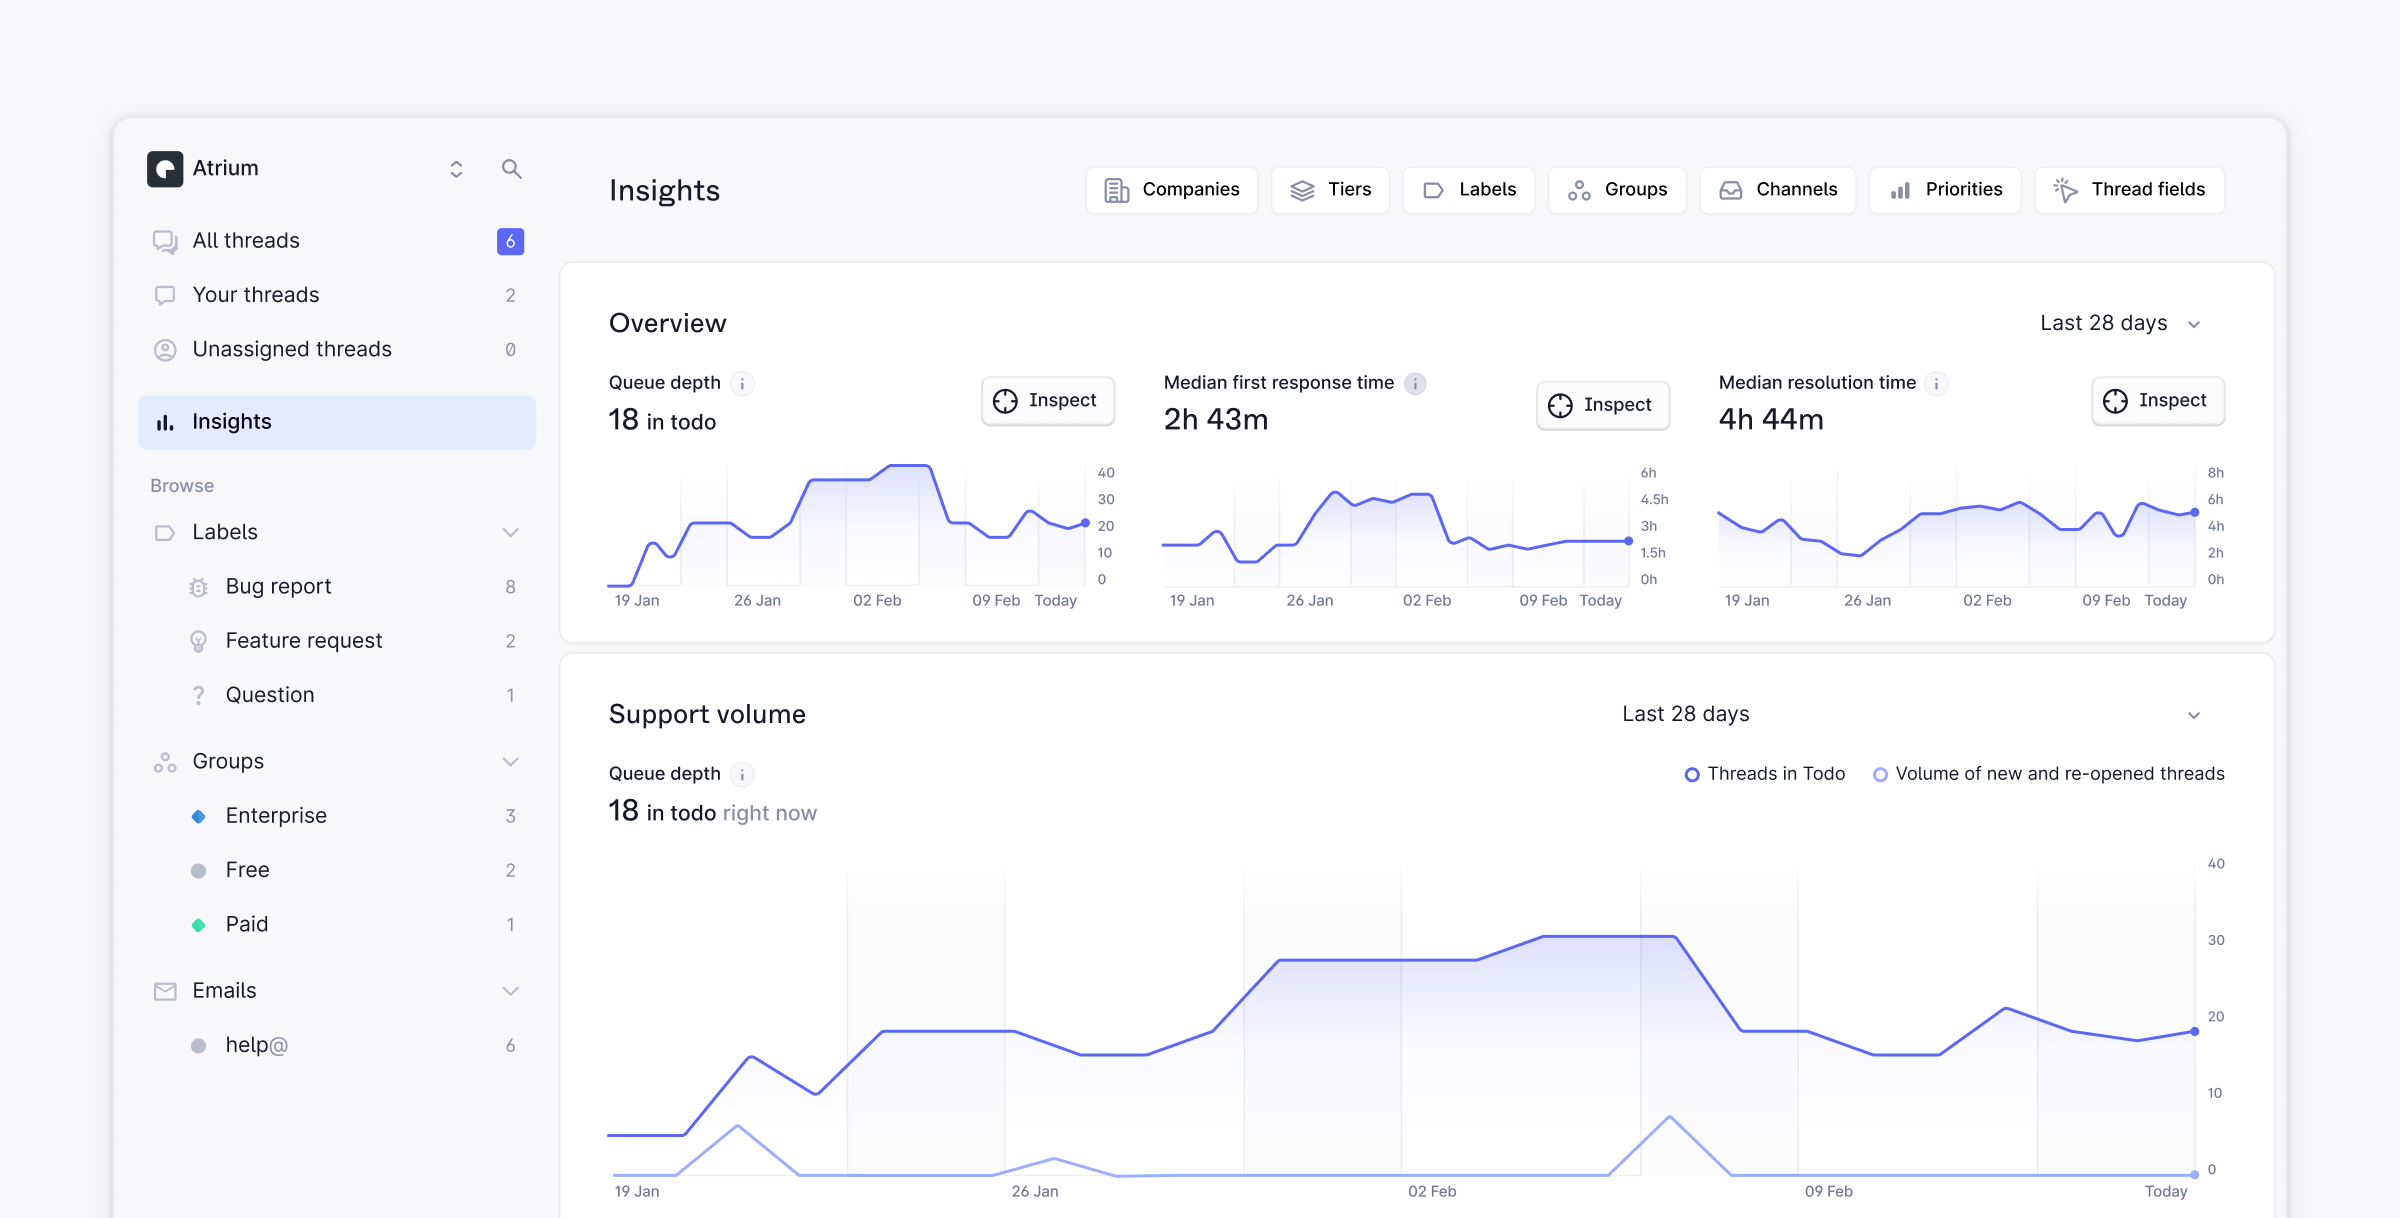
Get into the details
In each section of Insights, you will see a breakdown of your support by Channel, Company, Group, Label, Priority and Tier. This lets you see which attributes of a support request might be contributing to slower response times or increased volume.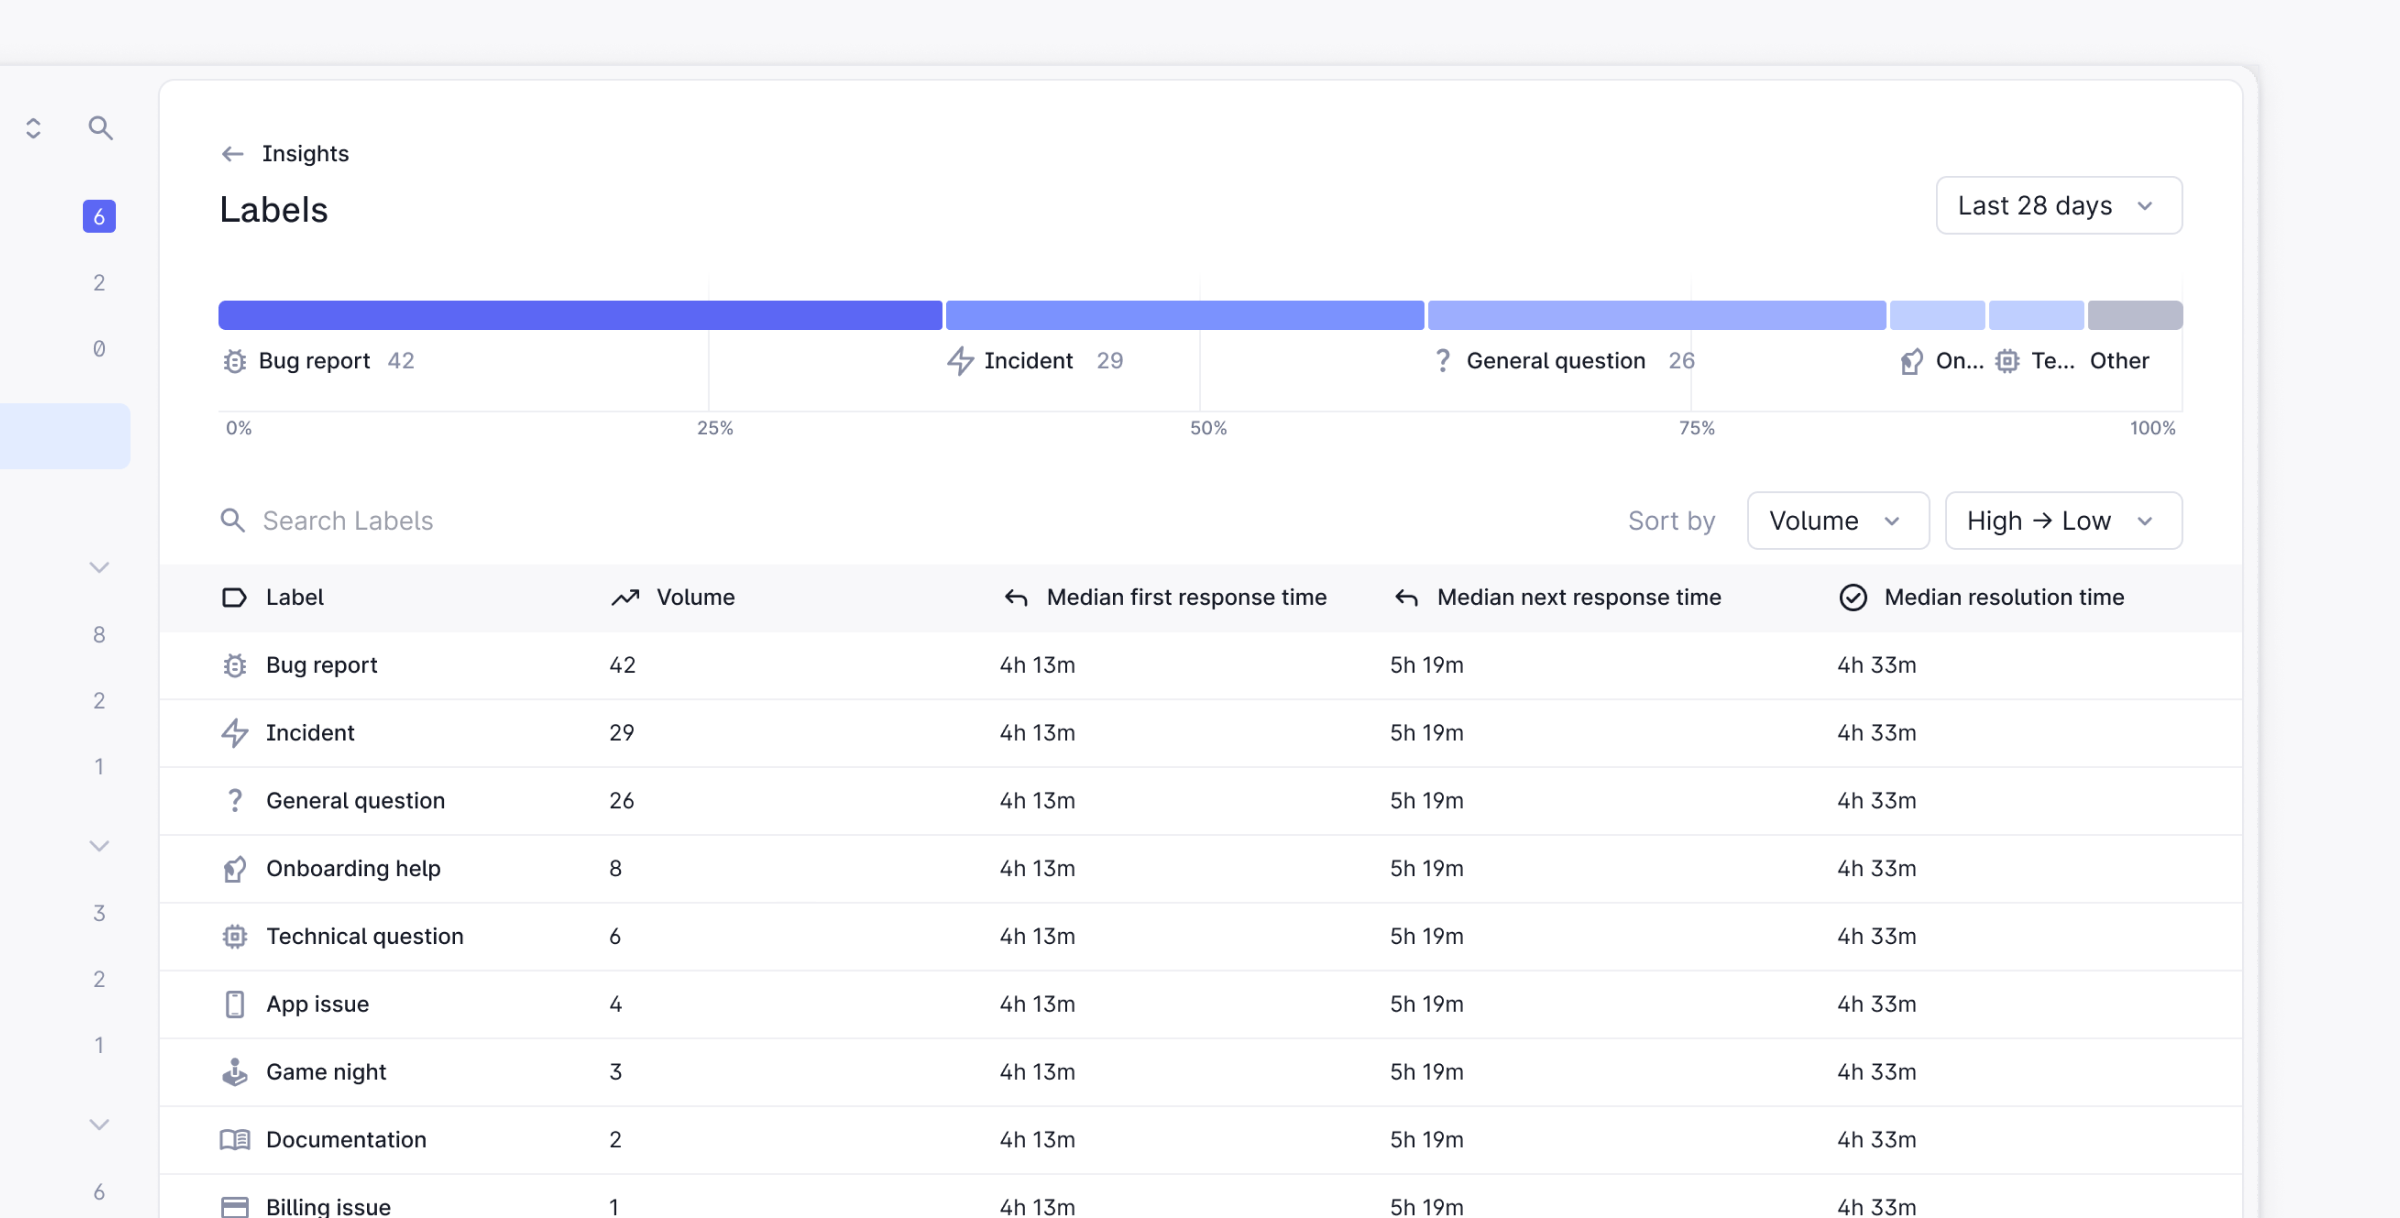
Check in from anywhere in Plain
Hover over any Company, Group, Label or Tier in Plain to instantly see a view of recent support volume. This is a great way to proactively identify trends in your data and improve your workflow.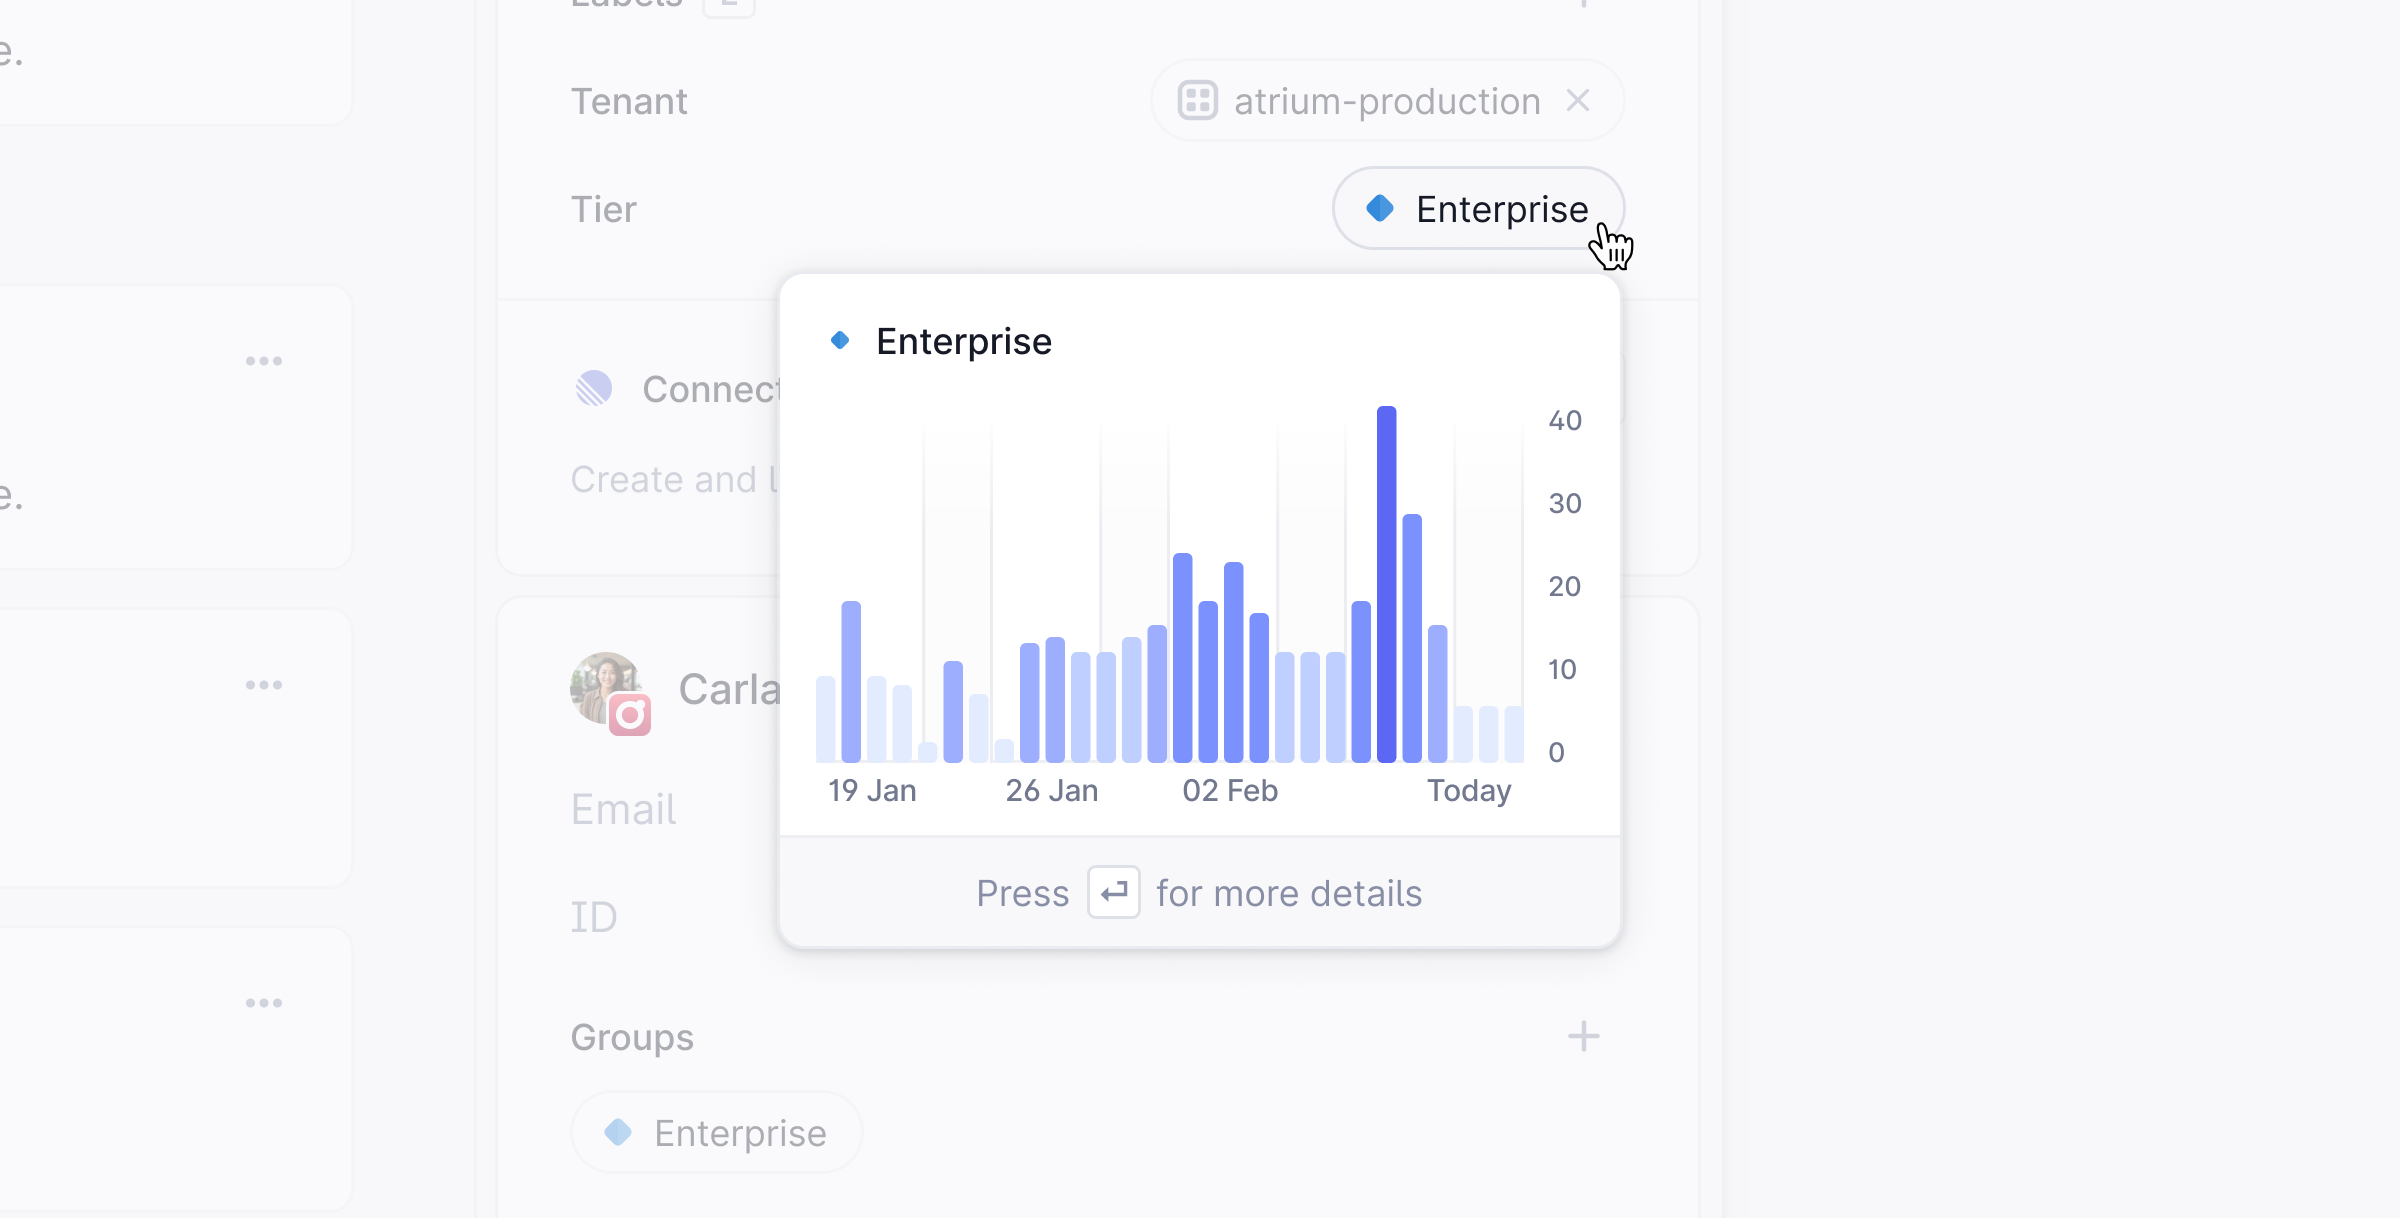
The Metrics
Now, the nerdy bit - this is a breakdown of the exact metrics we show in Insights and how they’re calculated. Note - All metrics can also be broken down by Channel, Company, Group, Label, Priority and Tier. Support volume
First response time
Resolution time